1. Secondary reactions in a target
1.Secondary reactions in a target
The question on the contribution of secondary reactions products in an output of exotic nuclei at relativistic energies is intriguing, as substantial growth of an exotic nucleus output is supposed due to two-step reactions in a thick target. Also it is necessary to apply a correction factor to deduce the production cross section to take into account the losses due to attenuation of the beam inside the target.
In a real case calculation of the contribution of secondary reactions represents system from large (for a case of a heavy ion beam) quantities of the differential equations which is not solved an analytical way. For fast estimations the summarized section is used in view of interaction of the given fragment with a target on basis Kox's predictions as it is made in work F.Rejmund et al. (GSI-Preprint 2000-06) where the measured apparent mass distribution was written as:

In the new version of the program the contribution of secondary reactions is not taken into account in calculations of transmission and outputs of fragments (due to durable calculations), but the User only can make a rating using the menu "Utilities" -> "Output of products from a target with the contribution of secondary reactions". Calculations are carried out step by step on the basis of system from j differential equations with given below start conditions:

Nuclei settle up only those which are in a rhombus (Nbeam+3, Zbeam+1), (Nbeam-3, Zbeam+1), (Nfrag+3, Zfrag-1), (Nfrag-3, Zfrag-1) to avoid superfluous calculations in the case of the fragment is found very far from the projectile. The given plot represents five distributions depending on thickness of a target, which describe the following:
As an example we shall take recent work on studying cross-sections of neutron-rich nuclei from 40Ar fragmentation at about 1 AGeV (A.Ozava et al, Nucl.Phys A673 (2000) 411). For super neutron-rich isotopes was used in this experiment the Be-target by thickness 4007 mg/cm2 (21.7 mm). On figures 1-4 calculations of outputs are presented depending on thickness of a target for this experiment. The first figure shows reduction of intensity of an initial beam. From three following strong influence of secondary reactions for unstable super neutron-rich nucleus 28O where their contribution exceeds on the order the contribution from initial reactions is visible.

Fig.1. 40Ar (beam) outputs in the reaction 40Ar(1AGeV)+Be(4007 mg/cm2)

Fig.2. 38Ar outputs in the reaction 40Ar(1AGeV)+Be(4007 mg/cm2)

Fig.3. 32Mg outputs in the reaction 40Ar(1AGeV)+Be(4007 mg/cm2)

Fig.4. 28O outputs in the reaction 40Ar(1AGeV)+Be(4007 mg/cm2)
Whence it is possible to draw a conclusion on expediency of use of beams at relativistic energies for reception super neutron-rich isotopes. There is a natural question: the same effect for proton-rich isotopes is expected? Calculations give the negative answer to this question. It is possible to show it a simple example. For a case 40Ar -> 28O through an intermediate nucleus of 32Mg product of cross sections is equal to 3.77e-7mb2 (6.5e-4 x 5.8e-4), whereas for a case 48Ni (58Ni -> 48Ni) through an intermediate nucleus 52Ni product is equal to 1.92e-12mb2 (1.6e-5 x 1.2e-7)! The difference between these products in 50000 times in consequence of that is not observed the contribution of secondary reactions to an output of 48Ni. Though for a case 124Xe+Be -> 100Sn the small contribution of secondary reactions is already observed.
2.1. Some distributions for cross section distribution
plot
| On a wish of users in the program was new opportunities for visualization of distributions of cross sections and others are entered: the user can look simultaneously some distributions (for different Z depending on mass and so on). It is possible to make selection of distributions: even Z, odd Z, and all distributions. In a figure on the right it is presented menus of a choice of distributions for the plot. |
 |
2.2. Possibility to plot transmitted fragments with given charge states
As a result of the analysis of the data physicist can select outputs of fragments on charge state conditions. In the previous versions the program deduced all charging conditions on one plot , that not always was convenient.. In the new version the opportunity by analogy to data analysis given has appeared to make selection on plots on charge state conditions. Installation of this option is carried out in the menu the "Plots" -> "Options".
2.3. Transmission characteristics plot
| The opportunity to observe distribution of characteristics of transmissions of fragments to plots has appeared ("Plots"-> "Transmission characteristics") in the new version at users. In other words it is possible to look outputs of fragments, outputs of charging states and to compare angular or spatial transmission of fragments and so on. (look a picture on the right). The example of this new type of the plots, representing an output of fragments with even Z and with a charge state condition equal Qt=Z is below submitted. |
 |

2.4. Manual scale of axis
| The program automatically finds optimum values of axes. With the help of zoom the user can increase scale. However to reduce for limits of the established values not it was possible earlier, though there is a necessity at times for comparison with other plots to change values of axes. In the new version the user can in manual change using an icon (see figure). |
 |
3.1. Momentum distributions from reactions
The program counts by default Gaussian curves for the momentum distribution
with widths from the Goldhaber formula (Phys.Lett.B53 (1974) 306):  .
.
However as the practice shows, many physics use for the description given other distributions, in particular take the width from the empirical systematic of Morrissey (Phys.Rev. C39 (1989) 460):
 .
.
The opportunity of a choice of momentum distribution width is included
in the new version of the program. Also the opportunity of use of the correction
for reduced width was added at small energies from distortions due to Coulomb
force (V.Borrel et al., Z.Phys.A 324 (1986) 205).
The opportunity of a choice of momentum distribution width is included
in the new version of the program. Also the opportunity of use of the correction
for reduced width was added at small energies from distortions due to Coulomb
force (V.Borrel et al., Z.Phys.A 324 (1986) 205).

3.2. Fragment velocity
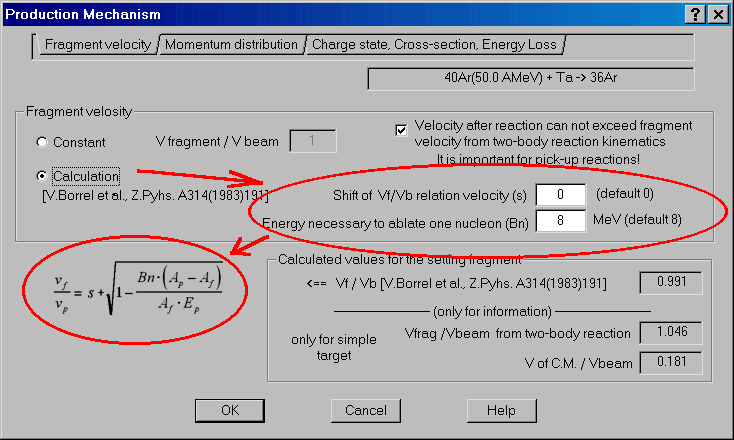
For the description of experimental data (J.M.Daugas et al., Phys.Lett.
B476, 2000, p.213) in the formula (V.Borrel et al, Z.Phys. A314, 1983,
p.191) of velocity of fragments after reaction were entered two parameters
which the user can change.
The first parameter is connected with energy which are necessary to
ablate one nucleon. Default value is equal to 8 MeV. Also it was added
a shift of the velocity relation. From comparison of experimental data
and the LISE’s simulation the shift is close to 0, but the energy to ablate
one nucleon is equal to 2 MeV.

3.3. Charge states distribution
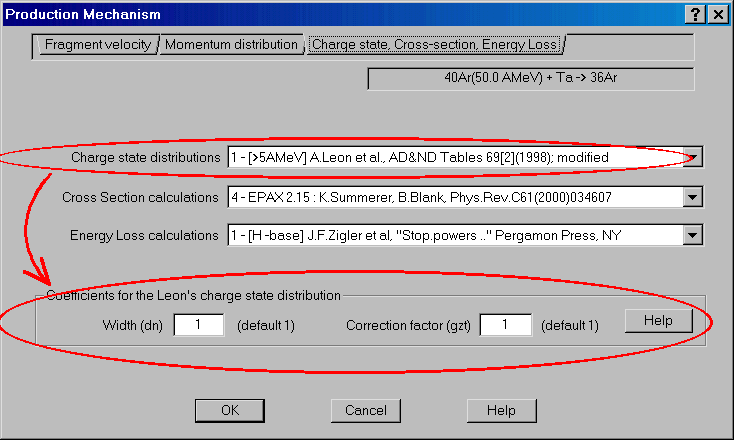
For the analysis given the same work that was mentioned earlier, parametrization of charging conditions was modified (A.Leon et al, AD and ND 69, 1998). There was to correct a width of distributions (the factor 1,14 which is mentioned in the article [A.Leon et al.] is entered) and two parameters are added. Values are by default equal 1.
The first parameter gzt is entered into the formula (11) and is responsible for position mean charge at equilibrium:

The second dn is accordingly entered into the formula (13) and allows to change width of distributions:
![]()
These parameters were entered only for simulation of experimental data and what physical basis does not carry.

4.1. New configuration files
It was added new configuration files for spectrometers RIPS at RIKEN, and A1200 at NSCL MSU. Configurations A1900 with its acceptances and a dispersion also were added, but optical factors (except for a dispersion) are taken equal 1 or 0 (see a file). This configuration was made only for estimations of products outputs on this spectrometer.
4.2. Total reaction cross section
In the previous version the total cross section of reaction was used only as the help information in the menu of the Utilities -> Reaction’s characteristics. In the new version the given section is used for an estimation of a fragments output in the new utility for calculation of the secondary reactions contribution. The total cross section was taken from work M.G.Saint-Laurent et al. (Z.Phys.A 332, 1989, p.457) where for a basis the Kox’s formula (S.Kox et al., Phys.Rev.C 35, 1987, p.1678) takes. Authors have taken linear dependence of parameter c with from energy that is true only for area energy 30 MeV per nucleon. For application of the given formula at relativistic energies the given parameter on the basis of Kox’s work was analytically described in the following kind:

4.3. Database half-lives
In previous version the database contained half-lives of nuclei only up to Z=74. In the new version the database of half-lives was completed on the basis of Nuclear wallet cards - 2000, Jagdish K.Tuli, BNL, PO Box 5000, Uton, NY 11973-5000
4.4. Corrections
It has been corrected: